

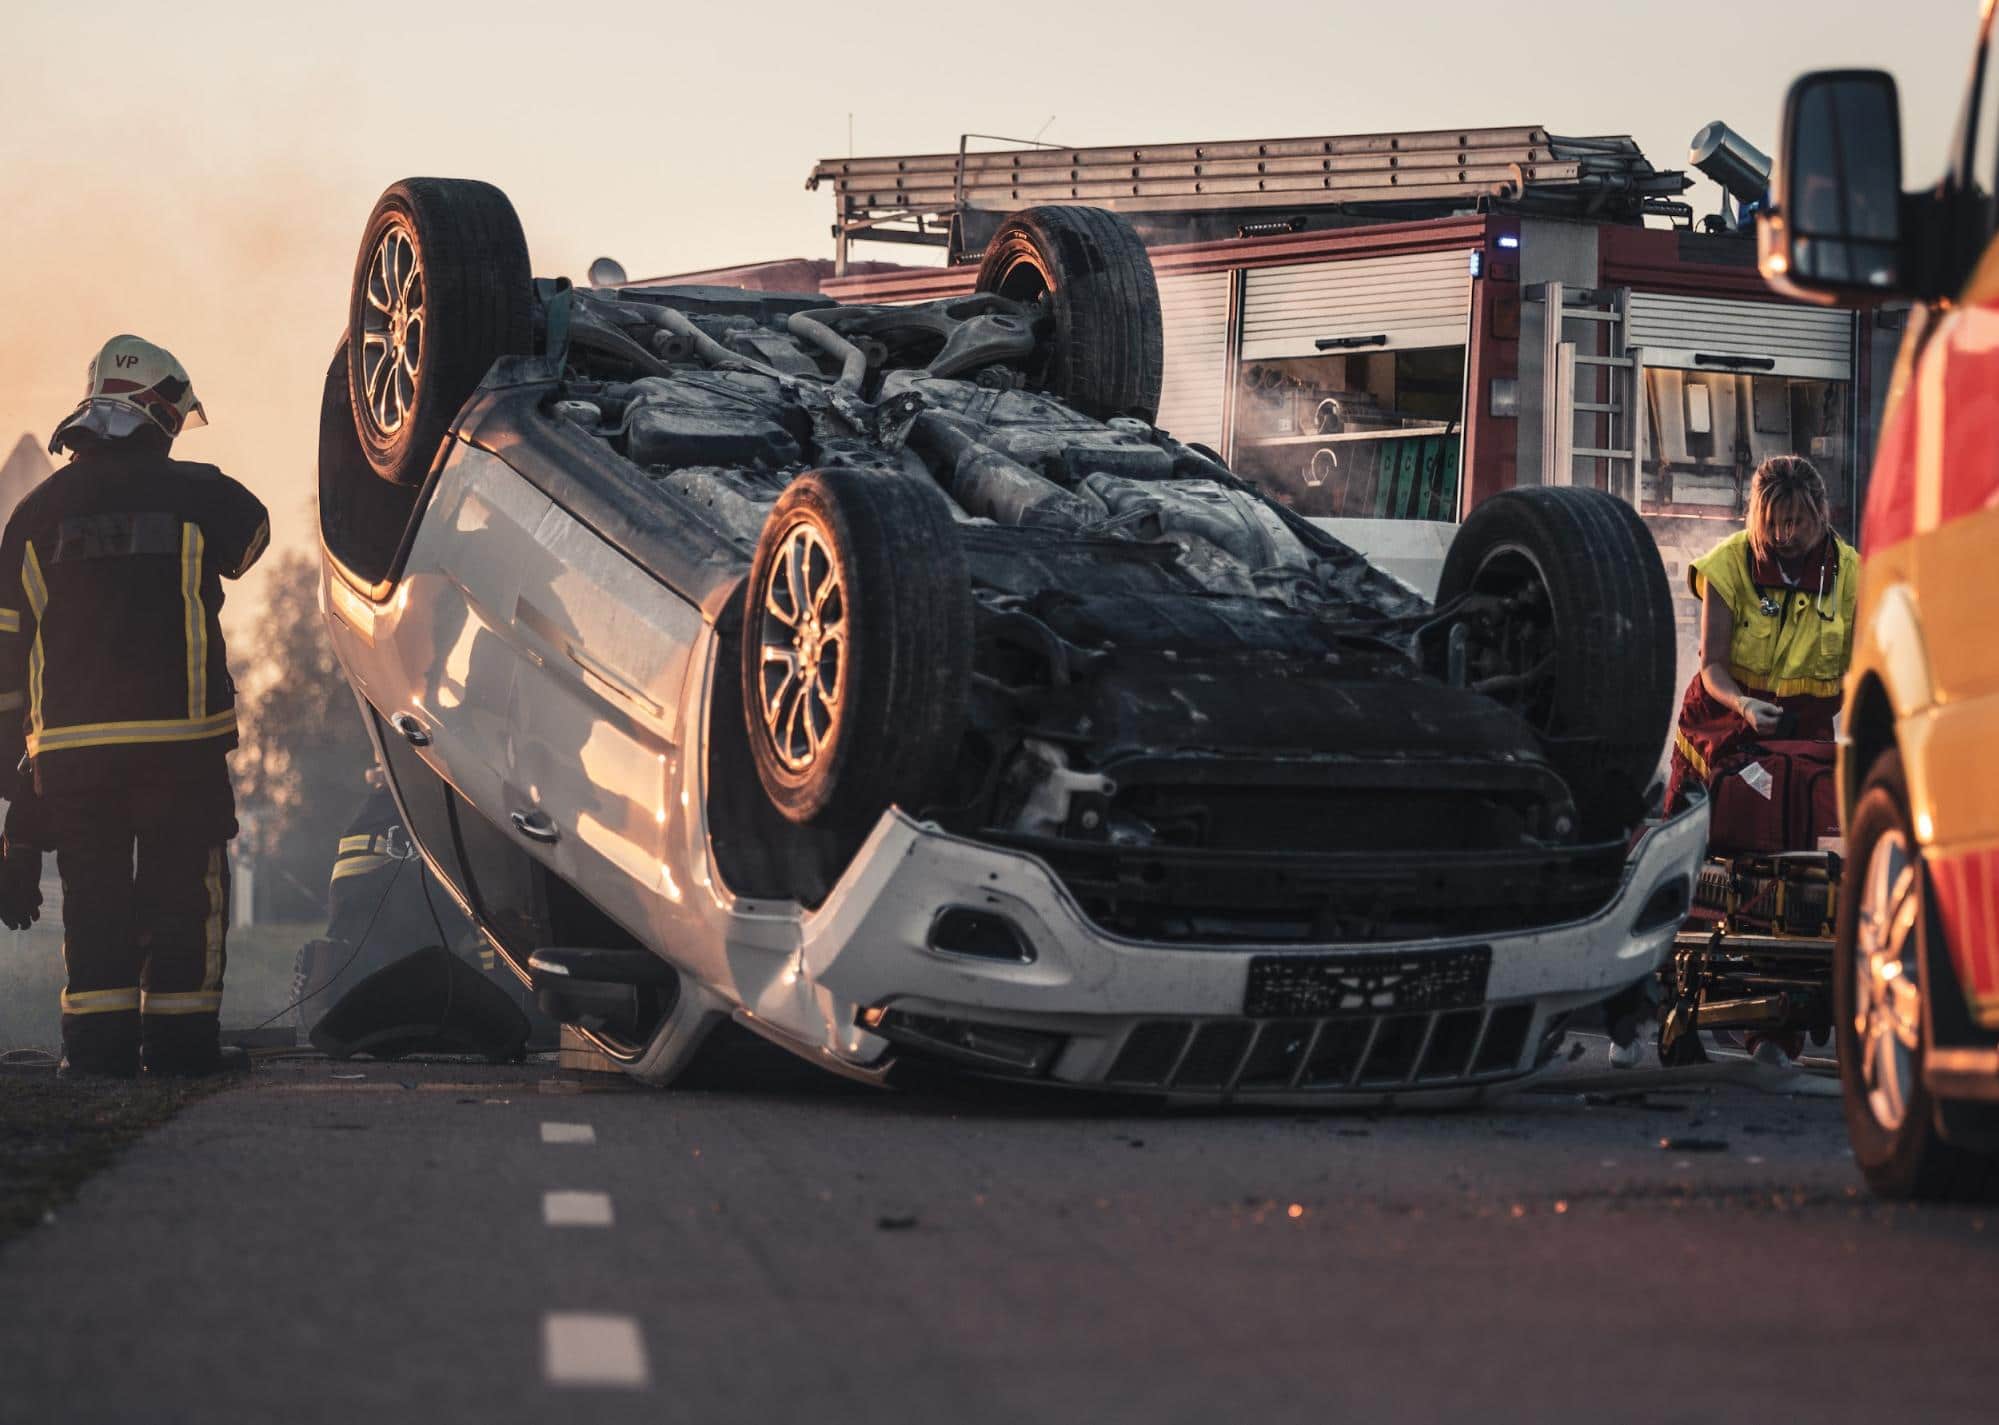
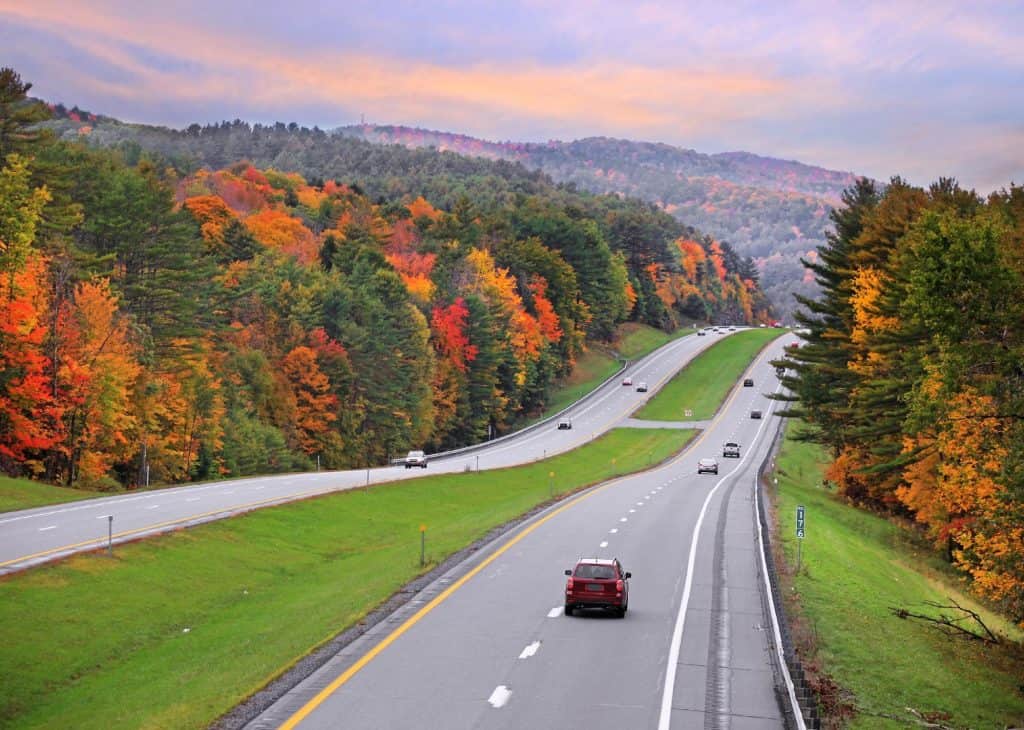
Gorodenkoff // Shutterstock
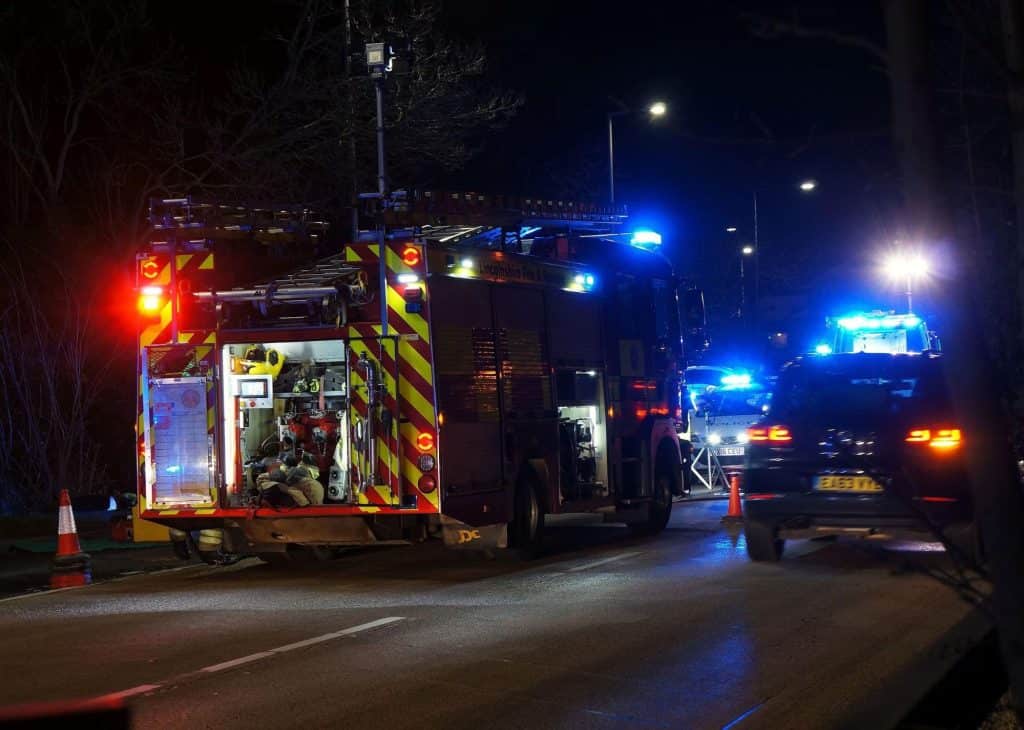
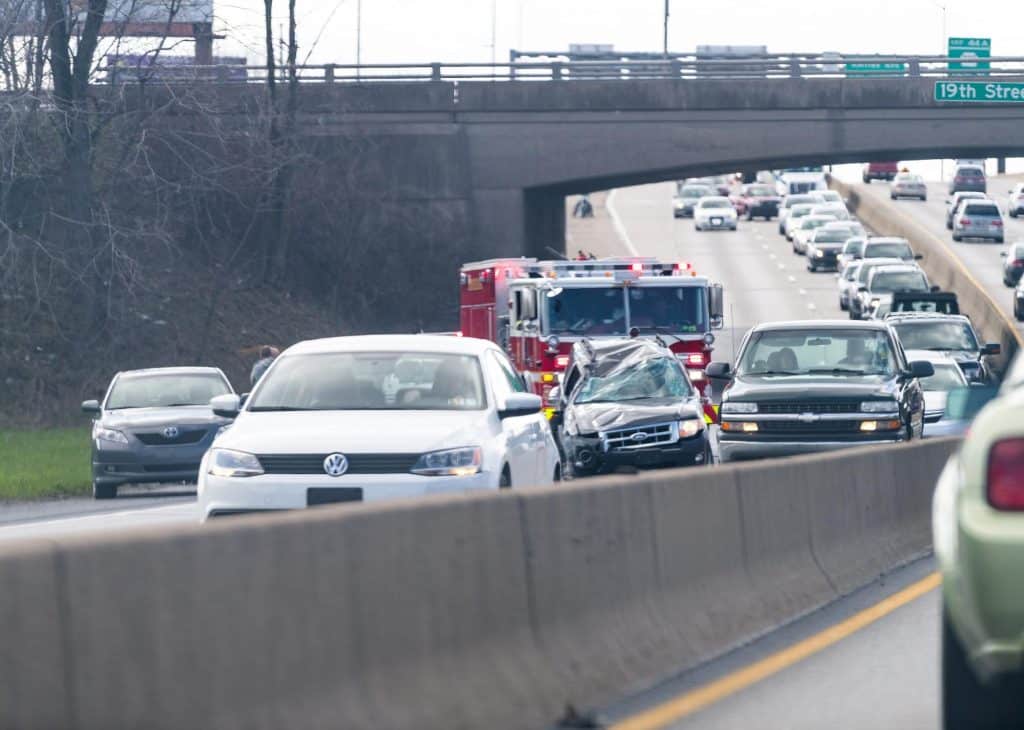
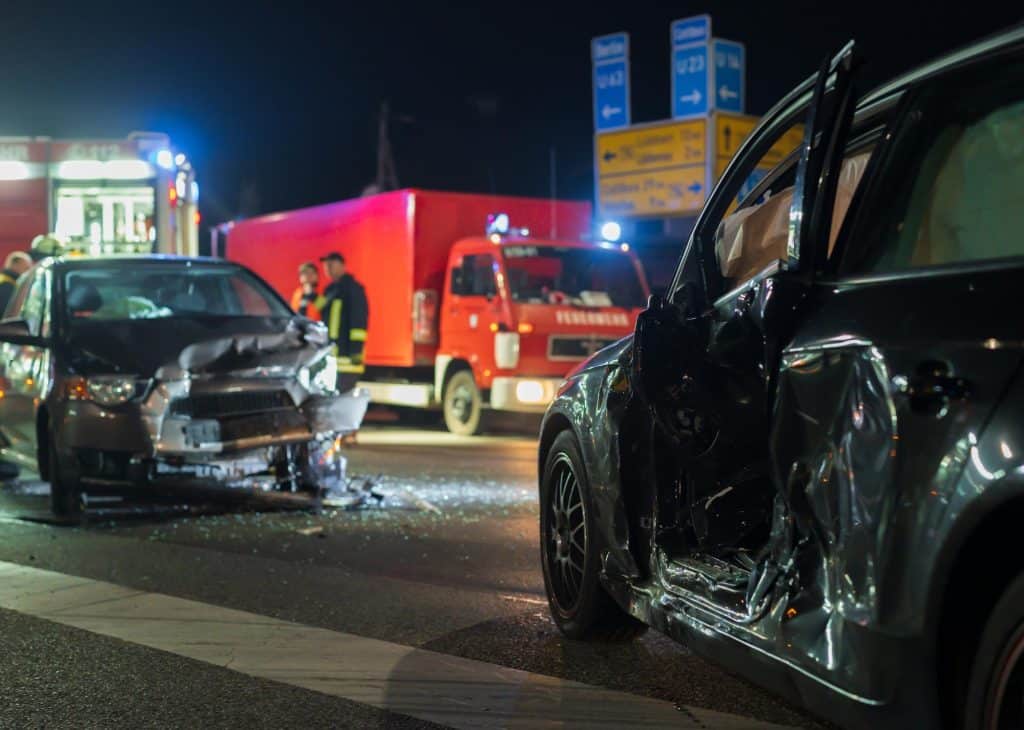
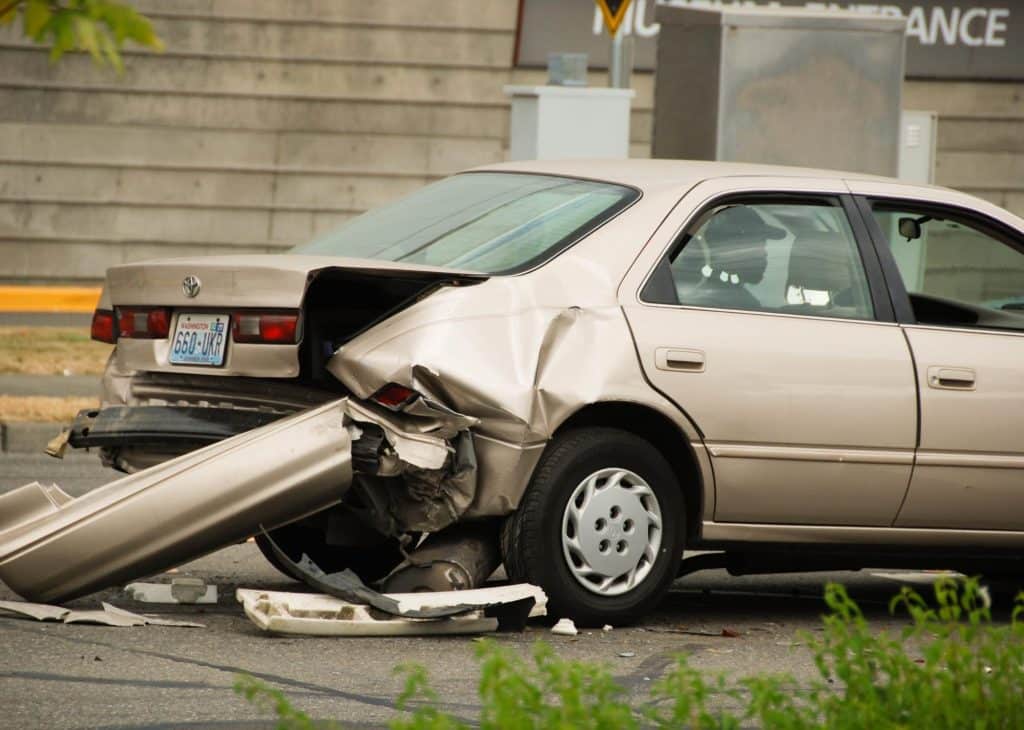
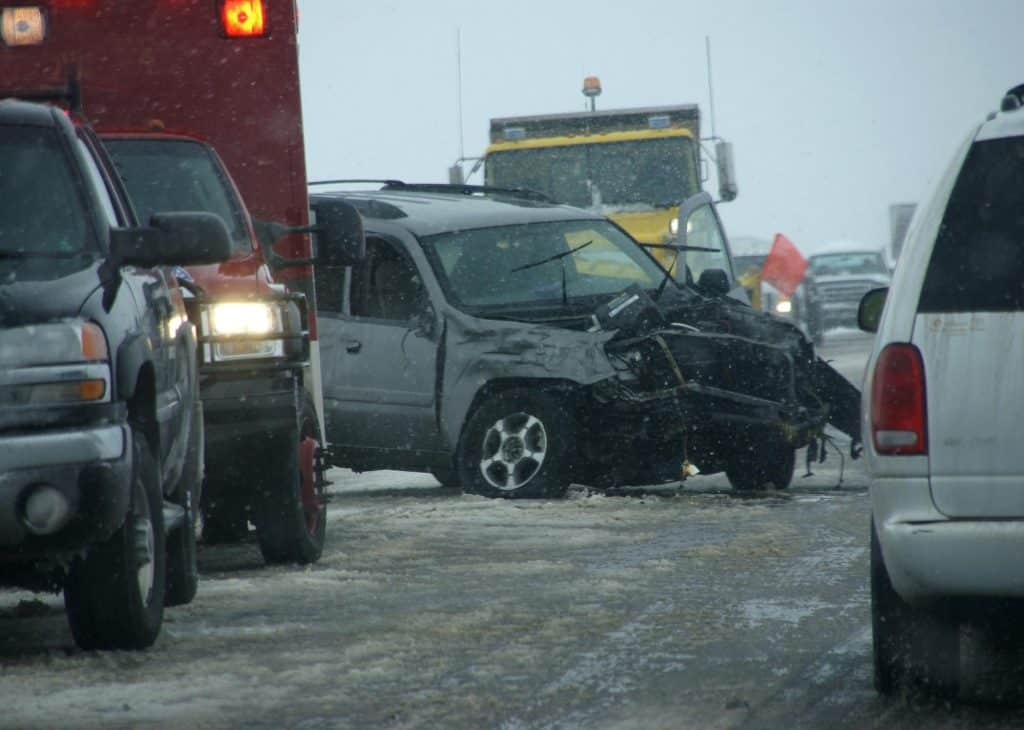
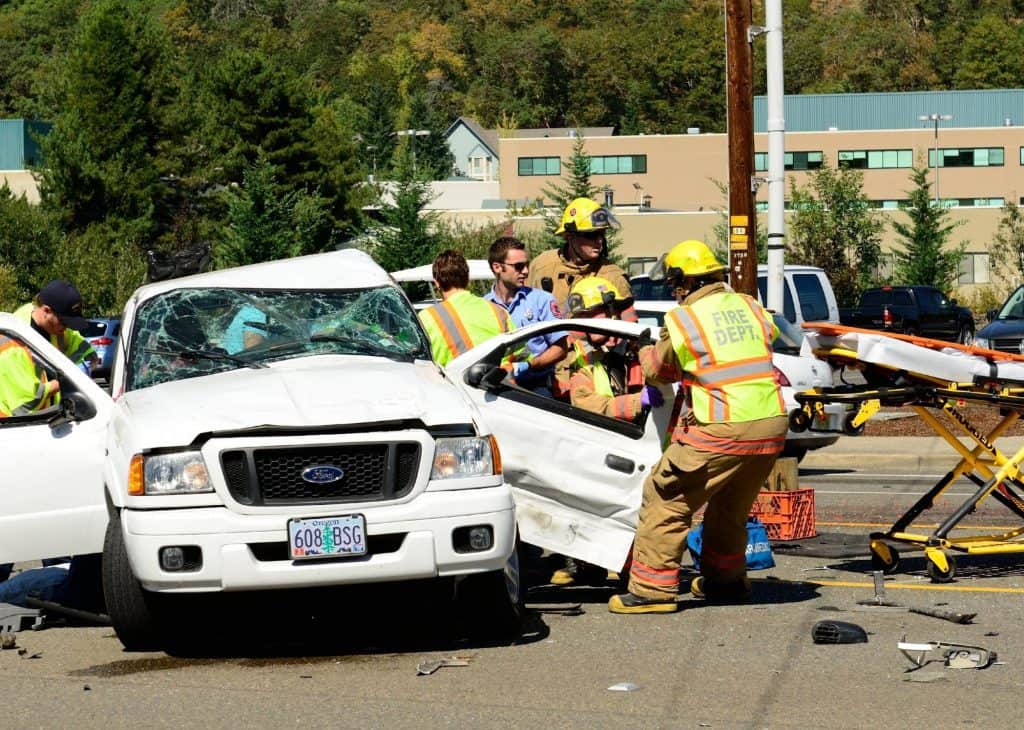
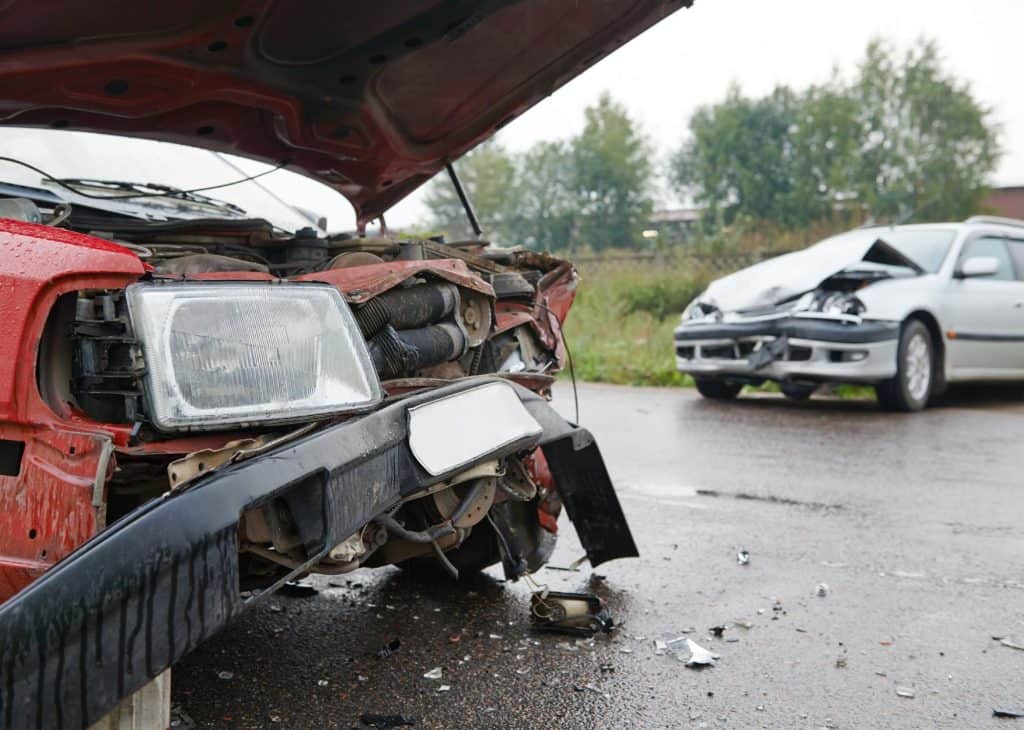
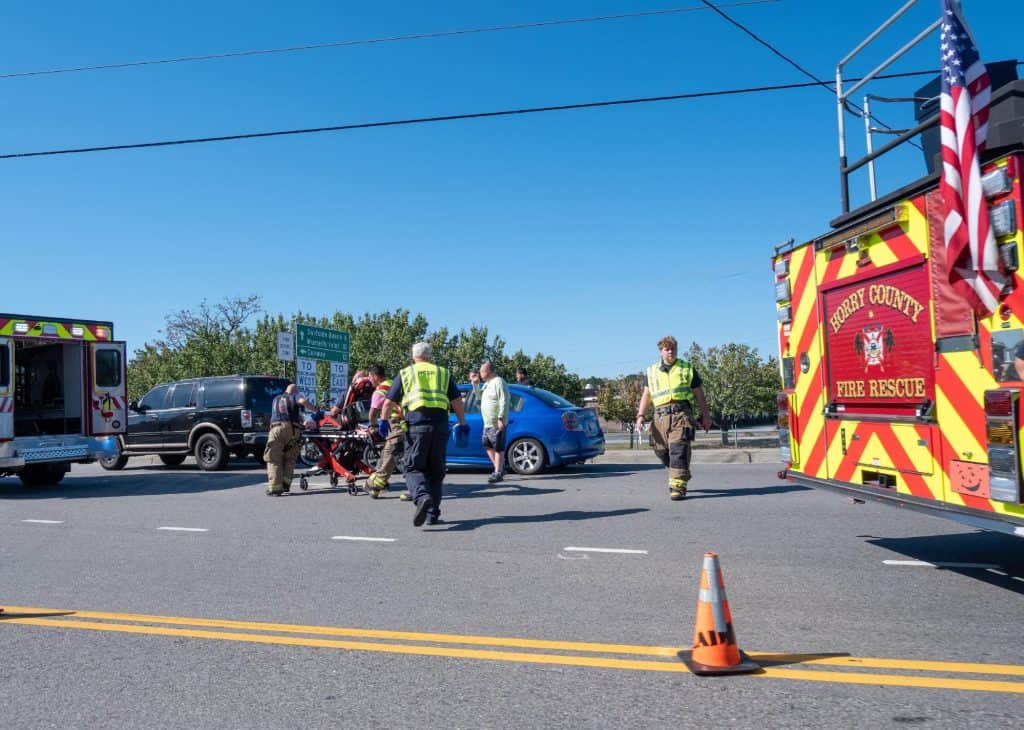
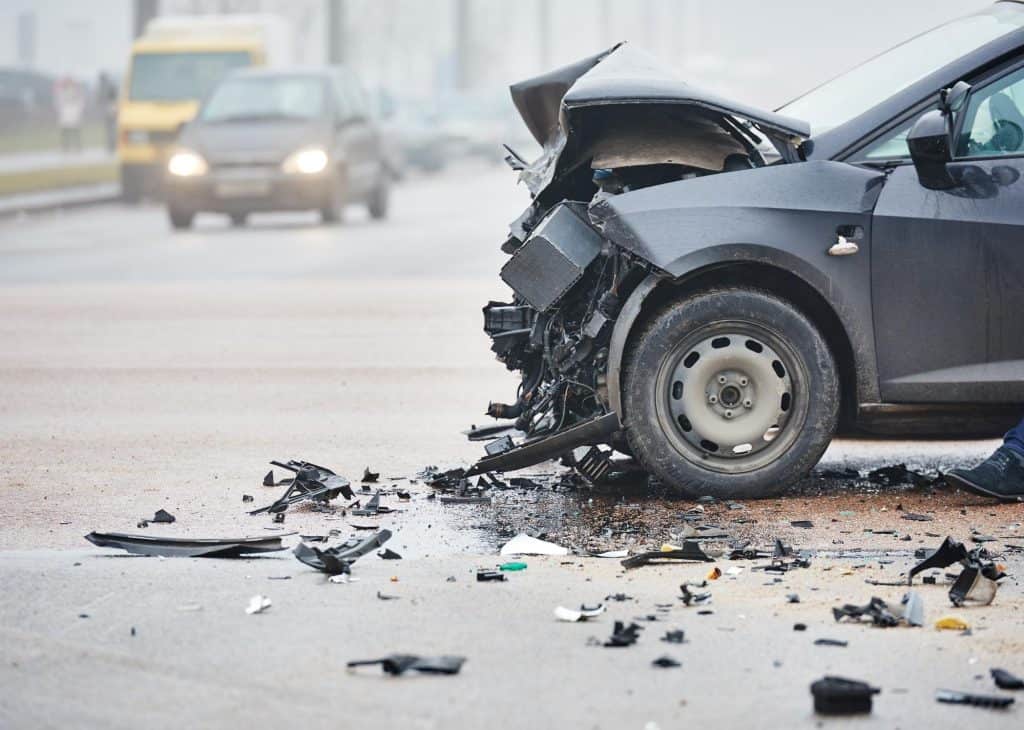
There were an estimated 42,795 fatalities due to motor vehicle crashes in 2022, down by 0.3% from the year prior, according to early estimates released in April 2023 from the National Highway Traffic Safety Administration.
While a reduction in crash-related deaths, even one as slight as this, is generally positive, the facts remain deeply concerning: Crash-related deaths rose more than 10% in 2021 and more than 7% the year before that, marking a disturbing trend leading into and persisting through the COVID-19 pandemic.
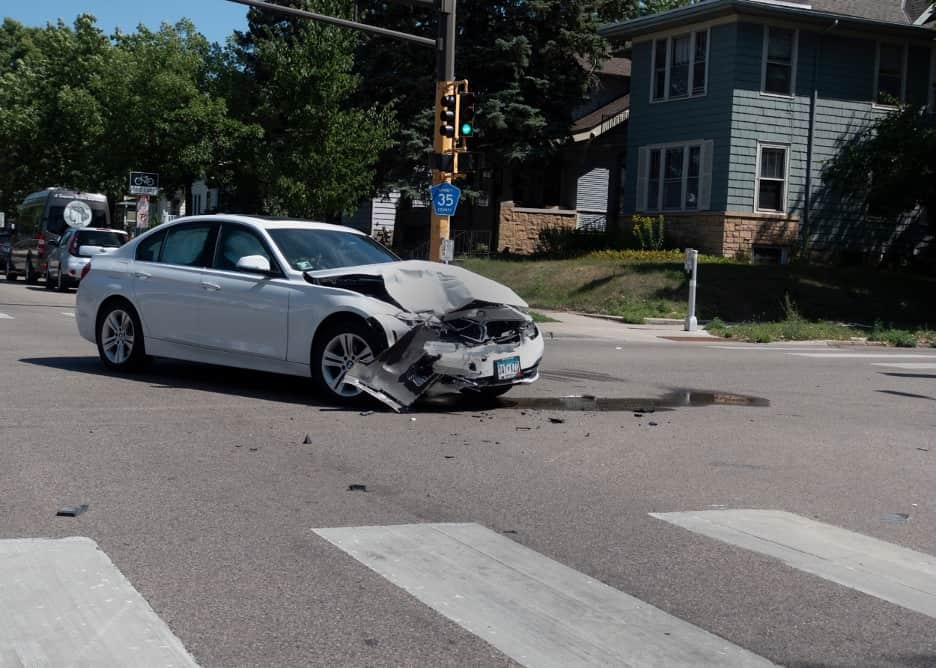
In 2021, the most recent full year of traffic-death data available, drunk driving fatalities rose by 14% from 2020. Monge and Associates cited drunk driving stats from NHTSA to identify states with the highest rate of fatalities from drunk driving car accidents. States are ranked by drunk driving fatalities per 100,000 residents. This rate is listed up to its first decimal point, but the exact ranking of states was determined from the total rate calculation, which did not result in ties.
A blood-alcohol content of .08 or higher is considered impaired. Judgment and driving abilities continue to worsen as BAC levels increase. Laws adopted between 1982 and 1997 throughout most of the U.S. successfully decreased the proportion of DUI-related motor vehicle fatalities in subsequent years.
Alternative transportation programs have also shown some promise in helping to deter drunk driving. Even in areas lacking robust transit options, recent studies suggest that alternatives such as rideshare services like Uber and Lyft can reduce drunk driving-related collisions.
Keep reading to see what percentage of car crash deaths in your state involved drunk driving.

Kristi Blokhin // Shutterstock
#52. Washington DC
– Drunk driving fatalities per 100k residents: 1.8 (12, 30% of all car crash fatalities)
– Fatalities involving driver with BAC 0.15 and above: 1.3 per 100K (9, 75% of all drunk driving fatalities)
– Change in drunk driving fatalities from 2012: 300% increase
If you were injured in DC, contact our Washington, DC personal injury lawyers today for a free consultation.
Andrew F. Kazmierski // Shutterstock
#51. New Jersey
– Drunk driving fatalities per 100k residents: 1.9 (178, 25% of all car crash fatalities)
– Fatalities involving driver with BAC 0.15 and above: 1.2 per 100K (114, 64% of all drunk driving fatalities)
– Change in drunk driving fatalities from 2012: 8.5% increase
If you were injured in New Jersey, contact our Newark personal injury lawyers today for a free consultation.
Adra Keri // Shutterstock
#50. Hawaii
– Drunk driving fatalities per 100k residents: 1.9 (28, 29% of all car crash fatalities)
– Fatalities involving driver with BAC 0.15 and above: 1.0 per 100K (14, 50% of all drunk driving fatalities)
– Change in drunk driving fatalities from 2012: 40.4% decrease
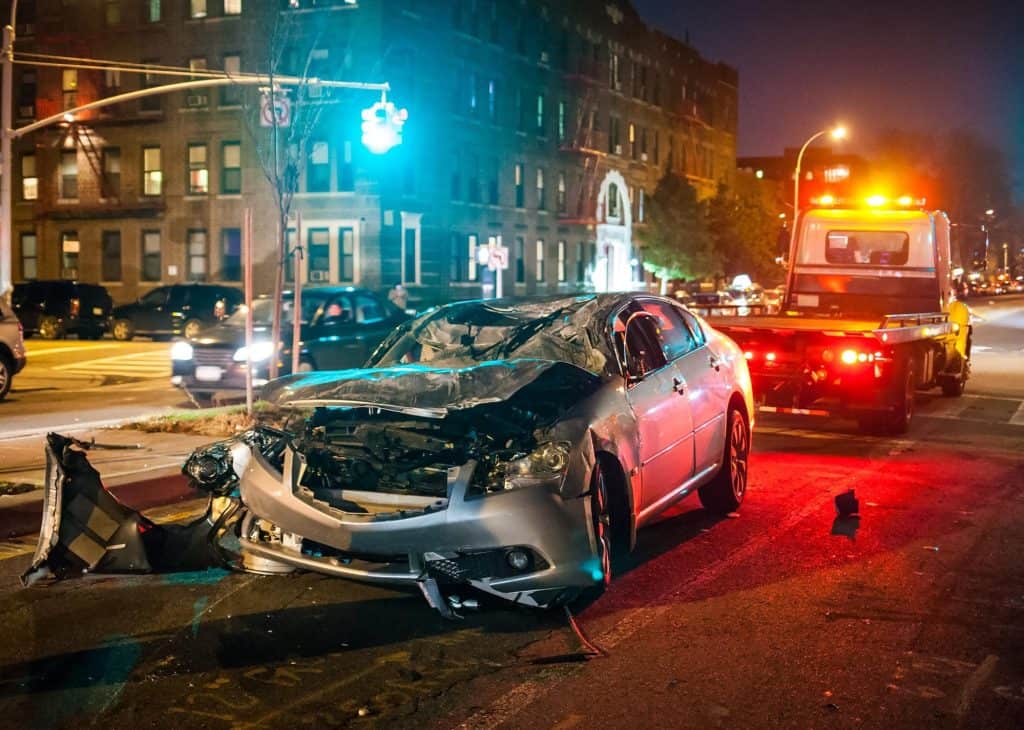
Photo Spirit // Shutterstock
#49. New York
– Drunk driving fatalities per 100k residents: 2.0 (388, 34% of all car crash fatalities)
– Fatalities involving driver with BAC 0.15 and above: 1.3 per 100K (249, 64.2% of all drunk driving fatalities)
– Change in drunk driving fatalities from 2012: 14.1% increase
Tony Dunn // Shutterstock
#48. Massachusetts
– Drunk driving fatalities per 100k residents: 2.1 (150, 36% of all car crash fatalities)
– Fatalities involving driver with BAC 0.15 and above: 1.4 per 100K (95, 63.3% of all drunk driving fatalities)
– Change in drunk driving fatalities from 2012: 16.3% increase
Injured in Massachusetts? Contact our Springfield personal injury lawyers or Boston personal injury lawyers for a free consultation.
Big Joe // Shutterstock
#47. Rhode Island
– Drunk driving fatalities per 100k residents: 2.2 (24, 39% of all car crash fatalities)
– Fatalities involving driver with BAC 0.15 and above: 1.6 per 100K (18, 75% of all drunk driving fatalities)
– Change in drunk driving fatalities from 2012: 14.3% decrease
Injured in Rhode Island? Get a free consultation with our Providence personal injury lawyers today.
Steve Skjold // Shutterstock
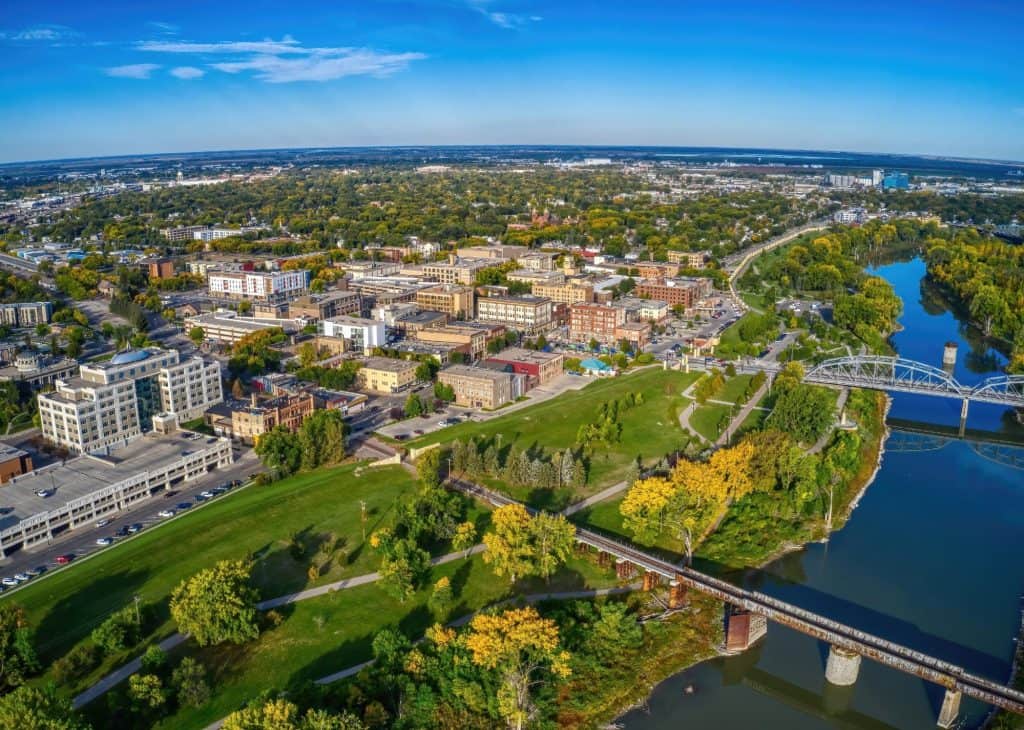
#46. Minnesota
– Drunk driving fatalities per 100k residents: 2.3 (130, 27% of all car crash fatalities)
– Fatalities involving driver with BAC 0.15 and above: 1.6 per 100K (90, 69.2% of all drunk driving fatalities)
– Change in drunk driving fatalities from 2012: 14% increase
Bob Pool // Shutterstock
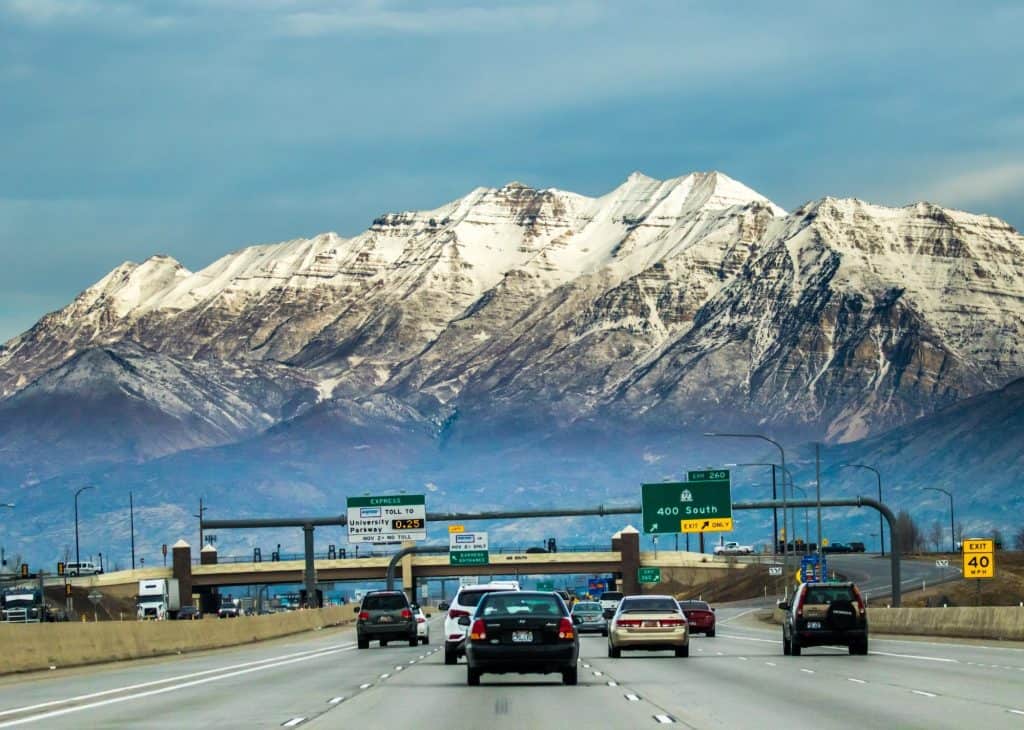
#45. Utah
– Drunk driving fatalities per 100k residents: 2.4 (79, 24% of all car crash fatalities)
– Fatalities involving driver with BAC 0.15 and above: 1.6 per 100K (52, 65.8% of all drunk driving fatalities)
– Change in drunk driving fatalities from 2012: 146.9% increase
Andriy Blokhin // Shutterstock
#44. Pennsylvania
– Drunk driving fatalities per 100k residents: 2.6 (337, 27% of all car crash fatalities)
– Fatalities involving driver with BAC 0.15 and above: 1.7 per 100K (221, 65.6% of all drunk driving fatalities)
– Change in drunk driving fatalities from 2012: 17.2% decrease
Injured in a Pennsylvania accident? Contact our Philadelphia personal injury lawyers for a free consultation.
O.C Ritz // Shutterstock
#43. Alaska
– Drunk driving fatalities per 100k residents: 3.0 (22, 33% of all car crash fatalities)
– Fatalities involving driver with BAC 0.15 and above: 1.9 per 100K (14, 63.6% of all drunk driving fatalities)
– Change in drunk driving fatalities from 2012: 46.7% increase
If you were injured in Alaska, contact our Anchorage personal injury lawyers today for a free consultation.

Sean Pavone // Shutterstock
#42. Connecticut
– Drunk driving fatalities per 100k residents: 3.1 (112, 38% of all car crash fatalities)
– Fatalities involving driver with BAC 0.15 and above: 2.0 per 100K (73, 65.2% of all drunk driving fatalities)
– Change in drunk driving fatalities from 2012: 12% increase
Injured in Connecticut, contact our New Haven personal injury lawyers today.

Suraju Kehinde // Shutterstock
#41. Maryland
– Drunk driving fatalities per 100k residents: 3.2 (195, 35% of all car crash fatalities)
– Fatalities involving driver with BAC 0.15 and above: 2.0 per 100K (124, 63.6% of all drunk driving fatalities)
– Change in drunk driving fatalities from 2012: 19.6% increase
Real Window Creative // Shutterstock
#40. Michigan
– Drunk driving fatalities per 100k residents: 3.2 (325, 29% of all car crash fatalities)
– Fatalities involving driver with BAC 0.15 and above: 2.2 per 100K (219, 67.4% of all drunk driving fatalities)
– Change in drunk driving fatalities from 2012: 24.5% increase
If you were injured by a drunk driver in Michigan, contact our Grand Rapids personal injury lawyers for a free consultation.
Alizada Studios // Shutterstock
#39. New Hampshire
– Drunk driving fatalities per 100k residents: 3.2 (45, 38% of all car crash fatalities)
– Fatalities involving driver with BAC 0.15 and above: 2.2 per 100K (31, 68.9% of all drunk driving fatalities)
– Change in drunk driving fatalities from 2012: 40.6% increase
Injured in New Hampshire? Get a free consultation with our Manchester personal injury lawyers today.
Kristi Blokhin // Shutterstock
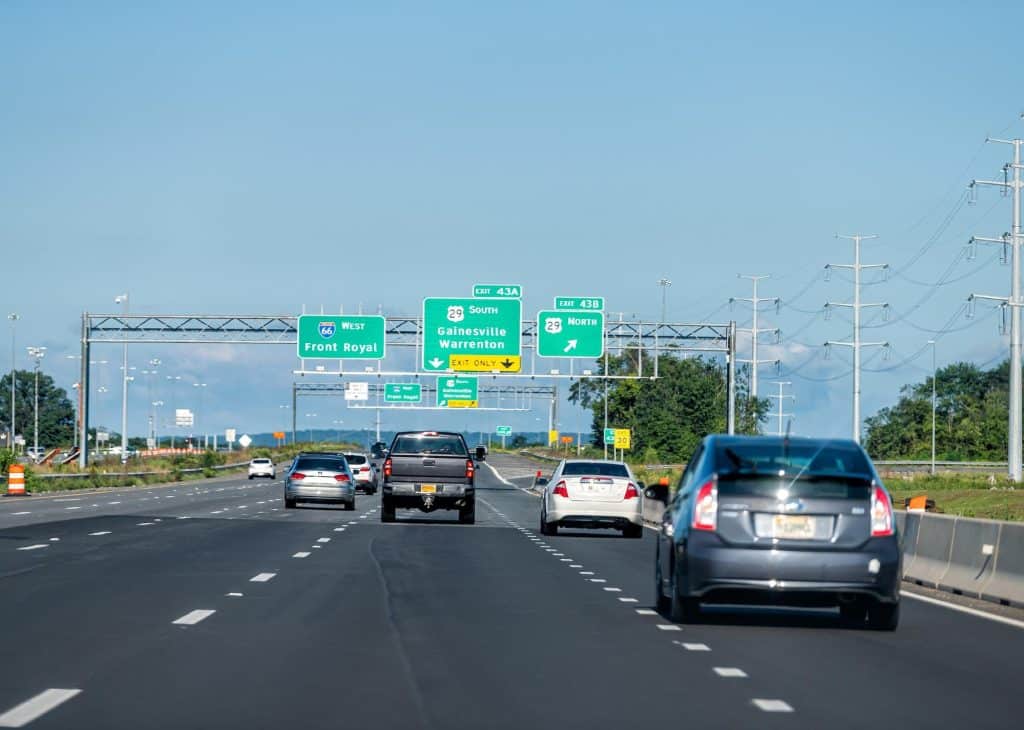
#38. Virginia
– Drunk driving fatalities per 100k residents: 3.2 (281, 29% of all car crash fatalities)
– Fatalities involving driver with BAC 0.15 and above: 2.2 per 100K (187, 66.5% of all drunk driving fatalities)
– Change in drunk driving fatalities from 2012: 34.4% increase
More on Virginia car accidents
Ronald Rampsch // Shutterstock
#37. Maine
– Drunk driving fatalities per 100k residents: 3.3 (45, 29% of all car crash fatalities)
– Fatalities involving driver with BAC 0.15 and above: 2.5 per 100K (35, 77.8% of all drunk driving fatalities)
– Change in drunk driving fatalities from 2012: 10% decrease
Injured in a Maine accident, get a free case review with our Portland personal injury lawyers.
Sandra Foyt // Shutterstock
#36. Nebraska
– Drunk driving fatalities per 100k residents: 3.3 (65, 29% of all car crash fatalities)
– Fatalities involving driver with BAC 0.15 and above: 2.2 per 100K (44, 67.7% of all drunk driving fatalities)
– Change in drunk driving fatalities from 2012: 11% decrease
Khairil Azhar Junos // Shutterstock
#35. Delaware
– Drunk driving fatalities per 100k residents: 3.4 (34, 25% of all car crash fatalities)
– Fatalities involving driver with BAC 0.15 and above: 2.1 per 100K (21, 61.8% of all drunk driving fatalities)
– Change in drunk driving fatalities from 2012: 2.9% decrease
Injured in a Delaware accident? Contact our Wilmington personal injury lawyers today.

DavidCarpio // Shutterstock
#34. Wisconsin
– Drunk driving fatalities per 100k residents: 3.4 (199, 32% of all car crash fatalities)
– Fatalities involving driver with BAC 0.15 and above: 2.1 per 100K (125, 62.8% of all drunk driving fatalities)
– Change in drunk driving fatalities from 2012: 1.5% decrease
If you were injured in Wisconsin, contact our Madison personal injury lawyers today.
Ceri Breeze // Shutterstock
#33. Washington
– Drunk driving fatalities per 100k residents: 3.4 (262, 39% of all car crash fatalities)
– Fatalities involving driver with BAC 0.15 and above: 2.3 per 100K (181, 69.1% of all drunk driving fatalities)
– Change in drunk driving fatalities from 2012: 83.2% increase
Shadowspeeder // Shutterstock
#32. Indiana
– Drunk driving fatalities per 100k residents: 3.4 (234, 25% of all car crash fatalities)
– Fatalities involving driver with BAC 0.15 and above: 2.2 per 100K (153, 65.4% of all drunk driving fatalities)
– Change in drunk driving fatalities from 2012: 1.7% increase
If you were injured in an Indiana accident, call our Indianapolis personal injury lawyers today for a free consultation.
David A Litman // Shutterstock
#31. California
– Drunk driving fatalities per 100k residents: 3.5 (1,370, 32% of all car crash fatalities)
– Fatalities involving driver with BAC 0.15 and above: 2.2 per 100K (880, 64.2% of all drunk driving fatalities)
– Change in drunk driving fatalities from 2012: 65.3% increase
If you were injured in California, contact our San Jose personal injury lawyers, San Diego personal injury lawyers, or San Francisco personal injury lawyers for a free consultation.
Christian Ouellet // Shutterstock
#30. Puerto Rico
– Drunk driving fatalities per 100k residents: 3.6 (116, 34% of all car crash fatalities)
– Fatalities involving driver with BAC 0.15 and above: 2.2 per 100K (73, 62.9% of all drunk driving fatalities)
– Change in drunk driving fatalities from 2012: 6.5% decrease
SNEHIT PHOTO // Shutterstock
#29. Vermont
– Drunk driving fatalities per 100k residents: 3.6 (23, 31% of all car crash fatalities)
– Fatalities involving driver with BAC 0.15 and above: 2.2 per 100K (14, 60.9% of all drunk driving fatalities)
– Change in drunk driving fatalities from 2012: 4.2% decrease
Injured in Vermont? Get a free consultation with our Burlington personal injury lawyers today.
New Visions Media // Shutterstock
#28. Georgia
– Drunk driving fatalities per 100k residents: 3.6 (391, 22% of all car crash fatalities)
– Fatalities involving driver with BAC 0.15 and above: 2.5 per 100K (272, 69.6% of all drunk driving fatalities)
– Change in drunk driving fatalities from 2012: 32.5% increase
If you were injured in a car accident, contact our Atlanta car accident lawyers today.

Matt Gush // Shutterstock
#27. Illinois
– Drunk driving fatalities per 100k residents: 3.6 (461, 35% of all car crash fatalities)
– Fatalities involving driver with BAC 0.15 and above: 2.6 per 100K (332, 72% of all drunk driving fatalities)
– Change in drunk driving fatalities from 2012: 43.2% increase

Sean Pavone // Shutterstock
#26. West Virginia
– Drunk driving fatalities per 100k residents: 3.6 (65, 23% of all car crash fatalities)
– Fatalities involving driver with BAC 0.15 and above: 2.6 per 100K (47, 72.3% of all drunk driving fatalities)
– Change in drunk driving fatalities from 2012: 30.9% decrease
Trevor Bexon // Shutterstock
#25. Nevada
– Drunk driving fatalities per 100k residents: 3.7 (116, 30% of all car crash fatalities)
– Fatalities involving driver with BAC 0.15 and above: 2.5 per 100K (80, 69% of all drunk driving fatalities)
– Change in drunk driving fatalities from 2012: 36.5% increase

A_Lesik // Shutterstock
#24. Iowa
– Drunk driving fatalities per 100k residents: 3.7 (118, 33% of all car crash fatalities)
– Fatalities involving driver with BAC 0.15 and above: 2.4 per 100K (78, 66.1% of all drunk driving fatalities)
– Change in drunk driving fatalities from 2012: 22.9% increase
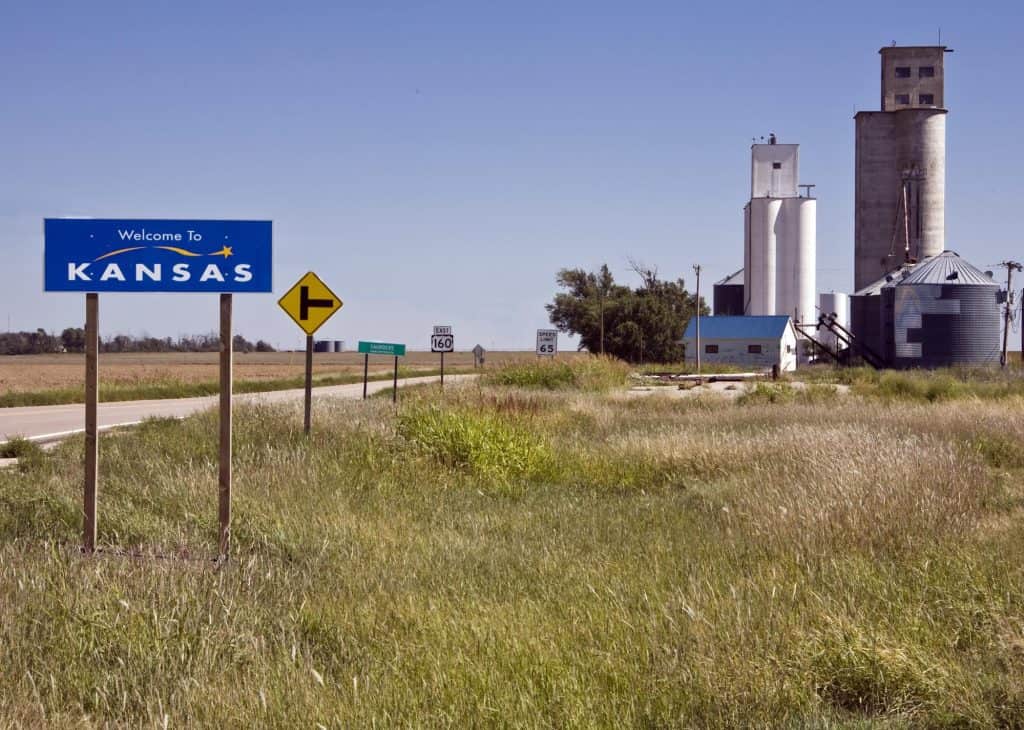
barteverett // Shutterstock
#23. Kansas
– Drunk driving fatalities per 100k residents: 3.7 (109, 26% of all car crash fatalities)
– Fatalities involving driver with BAC 0.15 and above: 2.6 per 100K (76, 69.7% of all drunk driving fatalities)
– Change in drunk driving fatalities from 2012: 4.8% increase

Paul Gana // Shutterstock
#22. Colorado
– Drunk driving fatalities per 100k residents: 3.7 (216, 31% of all car crash fatalities)
– Fatalities involving driver with BAC 0.15 and above: 2.7 per 100K (158, 73.1% of all drunk driving fatalities)
– Change in drunk driving fatalities from 2012: 61.2% increase

Wirestock Creators // Shutterstock
#21. Kentucky
– Drunk driving fatalities per 100k residents: 4.2 (190, 24% of all car crash fatalities)
– Fatalities involving driver with BAC 0.15 and above: 3.0 per 100K (136, 71.6% of all drunk driving fatalities)
– Change in drunk driving fatalities from 2012: 12.4% increase
If you were injured in Kentucky, contact our Lexington, Ky personal injury lawyers or Louisville personal injury lawyers today for a free consultation.
Jacob Boomsma // Shutterstock
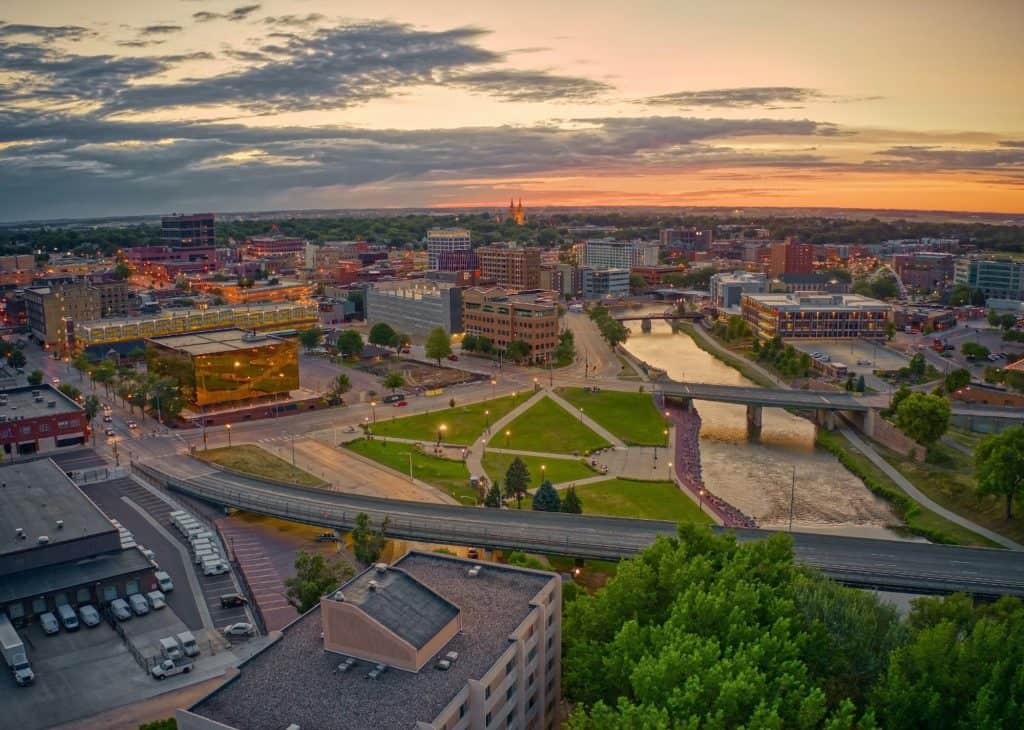
#20. North Dakota
– Drunk driving fatalities per 100k residents: 4.2 (33, 33% of all car crash fatalities)
– Fatalities involving driver with BAC 0.15 and above: 3.3 per 100K (26, 78.8% of all drunk driving fatalities)
– Change in drunk driving fatalities from 2012: 54.2% decrease
ESB Professional // Shutterstock
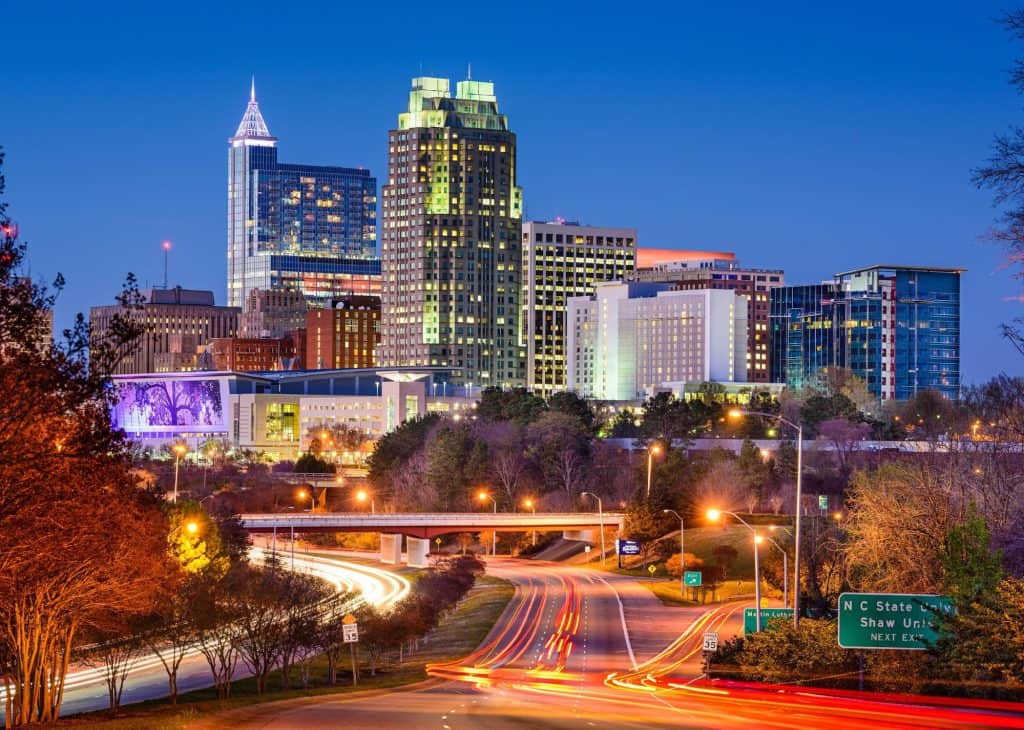
#19. North Carolina
– Drunk driving fatalities per 100k residents: 4.4 (466, 28% of all car crash fatalities)
– Fatalities involving driver with BAC 0.15 and above: 2.8 per 100K (300, 64.4% of all drunk driving fatalities)
– Change in drunk driving fatalities from 2012: 25.3% increase
steve estvanik // Shutterstock
#18. Idaho
– Drunk driving fatalities per 100k residents: 4.5 (85, 31% of all car crash fatalities)
– Fatalities involving driver with BAC 0.15 and above: 3.4 per 100K (65, 76.5% of all drunk driving fatalities)
– Change in drunk driving fatalities from 2012: 63.5% increase
If you were injured in an Idaho accident, contact our Boise personal injury attorneys today.
Kenneth Sponsler // Shutterstock
#17. Ohio
– Drunk driving fatalities per 100k residents: 4.5 (531, 39% of all car crash fatalities)
– Fatalities involving driver with BAC 0.15 and above: 3.2 per 100K (373, 70.2% of all drunk driving fatalities)
– Change in drunk driving fatalities from 2012: 36.5% increase

YES Market Media // Shutterstock
#16. Florida
– Drunk driving fatalities per 100k residents: 4.7 (1,019, 27% of all car crash fatalities)
– Fatalities involving driver with BAC 0.15 and above: 3.2 per 100K (688, 67.5% of all drunk driving fatalities)
– Change in drunk driving fatalities from 2012: 43.7% increase

Real Window Creative // Shutterstock
#15. Missouri
– Drunk driving fatalities per 100k residents: 4.7 (290, 29% of all car crash fatalities)
– Fatalities involving driver with BAC 0.15 and above: 3.2 per 100K (196, 67.6% of all drunk driving fatalities)
– Change in drunk driving fatalities from 2012: 2.5% increase

Gerson Repreza // Shutterstock
#14. Oklahoma
– Drunk driving fatalities per 100k residents: 4.8 (192, 25% of all car crash fatalities)
– Fatalities involving driver with BAC 0.15 and above: 3.5 per 100K (139, 72.4% of all drunk driving fatalities)
– Change in drunk driving fatalities from 2012: 8.1% decrease
TFoxFoto // Shutterstock
#13. Oregon
– Drunk driving fatalities per 100k residents: 5.1 (215, 36% of all car crash fatalities)
– Fatalities involving driver with BAC 0.15 and above: 3.3 per 100K (142, 66% of all drunk driving fatalities)
– Change in drunk driving fatalities from 2012: 144.3% increase
If you were injured in an Oregon accident, contact our Portland personal injury lawyers today for a free case evaluation.

Canva
#12. Tennessee
– Drunk driving fatalities per 100k residents: 5.1 (355, 27% of all car crash fatalities)
– Fatalities involving driver with BAC 0.15 and above: 3.5 per 100K (247, 69.6% of all drunk driving fatalities)
– Change in drunk driving fatalities from 2012: 24.1% increase
TLF Images // Shutterstock
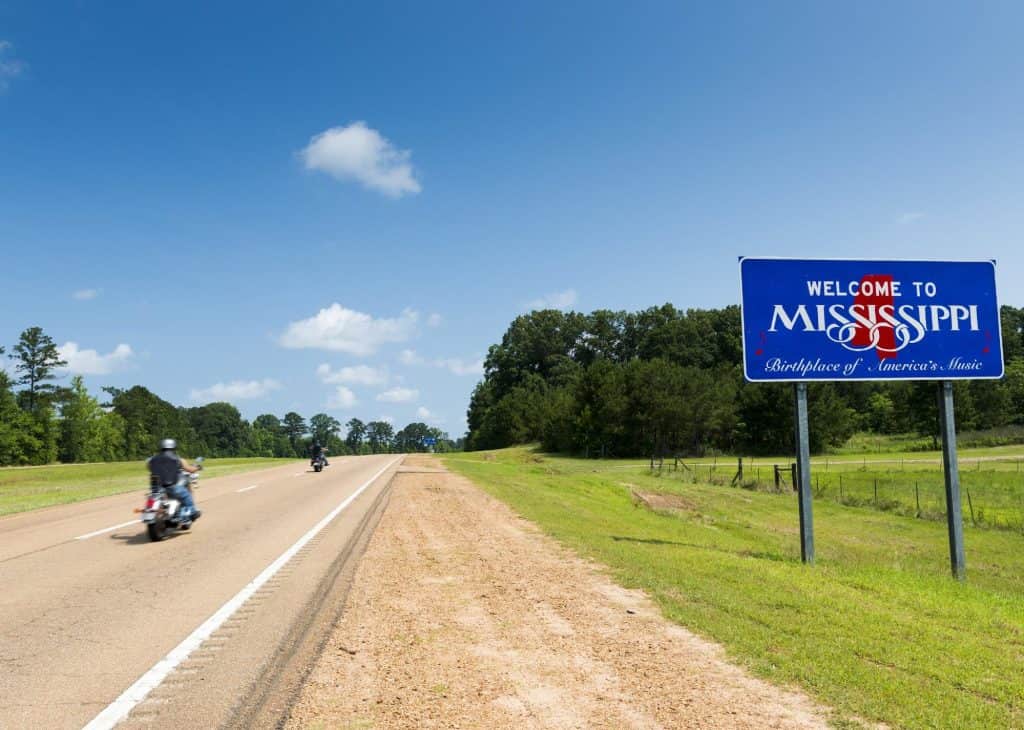
#11. Mississippi
– Drunk driving fatalities per 100k residents: 5.3 (155, 20% of all car crash fatalities)
– Fatalities involving driver with BAC 0.15 and above: 3.5 per 100K (102, 65.8% of all drunk driving fatalities)
– Change in drunk driving fatalities from 2012: 18.8% decrease
Sean Pavone // Shutterstock
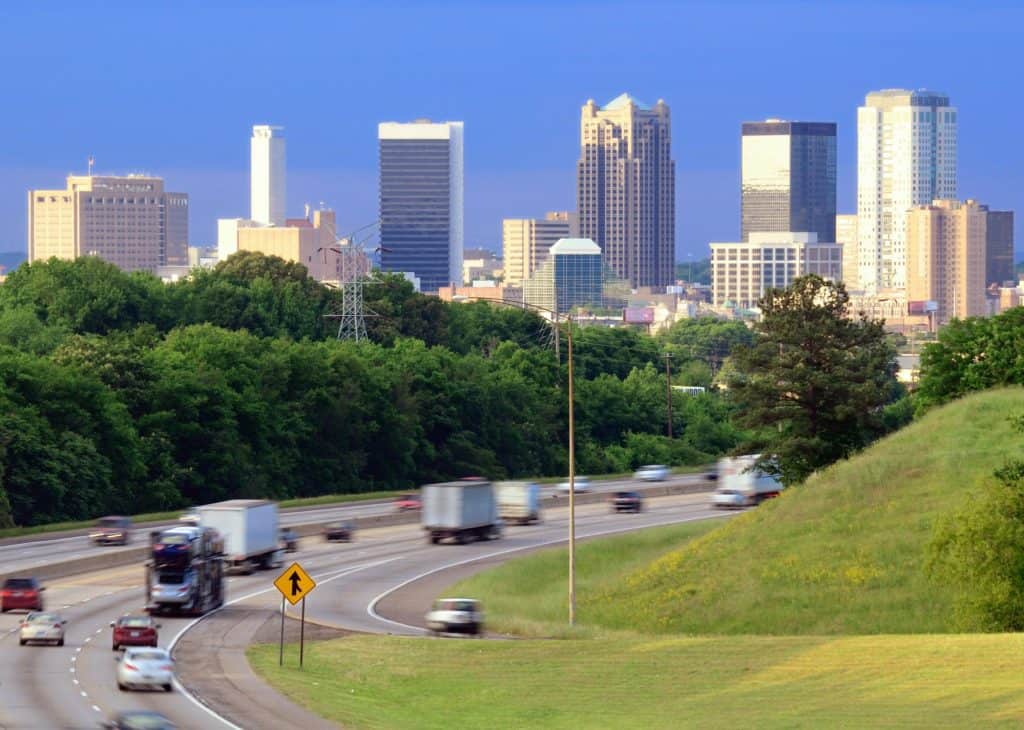
#10. Alabama
– Drunk driving fatalities per 100k residents: 5.6 (281, 29% of all car crash fatalities)
– Fatalities involving driver with BAC 0.15 and above: 3.5 per 100K (177, 63% of all drunk driving fatalities)
– Change in drunk driving fatalities from 2012: 17.1% increase
Johnny Coate // Shutterstock
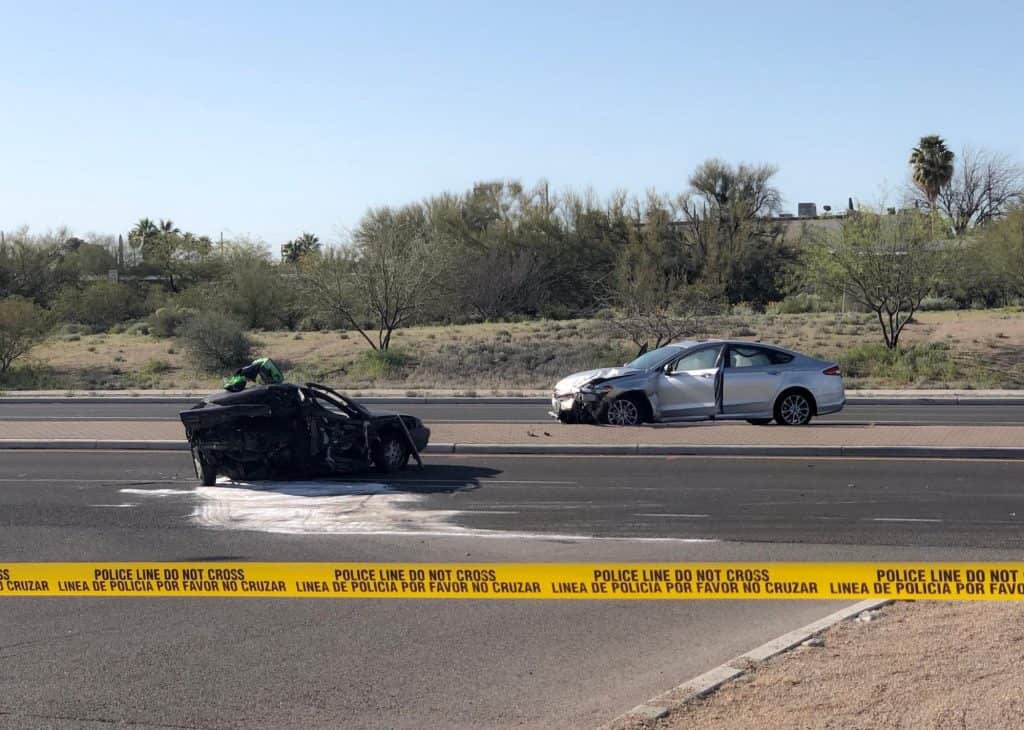
#9. Arizona
– Drunk driving fatalities per 100k residents: 5.8 (421, 36% of all car crash fatalities)
– Fatalities involving driver with BAC 0.15 and above: 3.8 per 100K (275, 65.3% of all drunk driving fatalities)
– Change in drunk driving fatalities from 2012: 83% increase
Injured in Arizona? Get your free case review with our Tucson personal injury lawyers today.
Jacob Boomsma // Shutterstock
#8. South Dakota
– Drunk driving fatalities per 100k residents: 5.8 (52, 35% of all car crash fatalities)
– Fatalities involving driver with BAC 0.15 and above: 4.8 per 100K (43, 82.7% of all drunk driving fatalities)
– Change in drunk driving fatalities from 2012: 18.2% increase
If you were injured in an accident, contact our Rapid City personal injury lawyers today for a free consultation.
Kristi Blokhin // Shutterstock
#7. Arkansas
– Drunk driving fatalities per 100k residents: 6.1 (185, 27% of all car crash fatalities)
– Fatalities involving driver with BAC 0.15 and above: 3.8 per 100K (116, 62.7% of all drunk driving fatalities)
– Change in drunk driving fatalities from 2012: 28.5% increase
Moab Republic // Shutterstock
#6. Texas
– Drunk driving fatalities per 100k residents: 6.4 (1,906, 42% of all car crash fatalities)
– Fatalities involving driver with BAC 0.15 and above: 4.4 per 100K (1,301, 68.3% of all drunk driving fatalities)
– Change in drunk driving fatalities from 2012: 47.8% increase
William A. Morgan // Shutterstock
#5. Louisiana
– Drunk driving fatalities per 100k residents: 6.5 (299, 31% of all car crash fatalities)
– Fatalities involving driver with BAC 0.15 and above: 4.4 per 100K (203, 67.9% of all drunk driving fatalities)
– Change in drunk driving fatalities from 2012: 27.2% increase

Jacob Boomsma // Shutterstock
#4. Wyoming
– Drunk driving fatalities per 100k residents: 6.6 (38, 34% of all car crash fatalities)
– Fatalities involving driver with BAC 0.15 and above: 5.0 per 100K (29, 76.3% of all drunk driving fatalities)
– Change in drunk driving fatalities from 2012: 7.3% decrease
If you were injured in a Wyoming accident, contact our Casper personal injury lawyers or our Cheyenne personal injury lawyers today.
Dmitry Kalinovsky // Shutterstock
#3. New Mexico
– Drunk driving fatalities per 100k residents: 7.3 (154, 32% of all car crash fatalities)
– Fatalities involving driver with BAC 0.15 and above: 5.2 per 100K (111, 72.1% of all drunk driving fatalities)
– Change in drunk driving fatalities from 2012: 58.8% increase
Chris Perello // Shutterstock
#2. South Carolina
– Drunk driving fatalities per 100k residents: 7.7 (401, 33% of all car crash fatalities)
– Fatalities involving driver with BAC 0.15 and above: 5.4 per 100K (282, 70.3% of all drunk driving fatalities)
– Change in drunk driving fatalities from 2012: 15.2% increase
Dmitry Kalinovsky // Shutterstock
#1. Montana
– Drunk driving fatalities per 100k residents: 9.4 (104, 44% of all car crash fatalities)
– Fatalities involving driver with BAC 0.15 and above: 6.7 per 100K (74, 71.2% of all drunk driving fatalities)
– Change in drunk driving fatalities from 2012: 16.9% increase
Injured in Montana? Get a free consultation with our Billings personal injury lawyers today.
Story Written by Nicole Caldwell